Sorting Out All The SaaS Metrics
When talking about a SaaS business, it would be easy to make bad assumptions simply because we weren’t all on the same page. Confusing Annual Recurring Revenue (ARR) with recognized revenue is an example of a simple difference in definition that in one SaaS business may be negligible while in another SaaS business could be huge. The following is a short list of common SaaS terms, many of which are frequently confused or misinterpreted.
ACV Annual Contract Value

ACV differs from TCV quite a bit, and it differs from ARR slightly. ACV or annual contract value is a common term, but it sometimes varies in definition from company to company. ACV is not likely to be considered a hard and true SaaS metric. Someone might say to you in passing, “what is your ACV?” They probably meant to ask what is your average ACV across recent customers. MRR or ARR are more meaningful ways to understand a SaaS business. A more common use of ACV is where a multi-year contract is in place, and it needs to be normalized into annual dollars. ACV does not include services or other one-time revenues like TCV does.
ARPU & ARPA Average Revenue Per User or Account

A B2B SaaS business can find great value in tracking ARPU or ARPA on a monthly basis to test assumptions of upgrades and downgrades from plan to plan. This metric works hand-in-hand with daily and monthly active user metrics (DAU, MAU). It is also valuable to break ARPU or ARPA into cohorts. For instance, total recurring revenue from new accounts gained in the trailing quarter is divided by the number of accounts gained in the same period. Then, compare that quarter over quarter.
ARR Annual Recurring Revenue
Now this is the good stuff. Recurring revenue from subscriptions is the foundation of the SaaS business model. The fastest, easiest, and maybe the most common way to compare metrics across SaaS businesses is to use ARR. There are basically 2 ways to grab this metric. The first is historical using recognized revenue. Assuming your chart of accounts is designed correctly to segment recurring from non-recurring revenue, it should be quick and easy to pull your trailing twelve month (TTM) recurring revenue. That’s historical ARR. Problem is that does not represent the present, only the past, and definitely not the future. Hence the need for a second way. Since with most SaaS businesses the renewal dates for annual agreements vary throughout the year, it is a key element of ARR to know the current month’s MRR. The first method we used does not consider upgrades, downgrades, expansions, and contractions. Knowing the current month’s MRR is a more accurate indicator of the SaaS business’s health. We could also add a third method to forecast an ARR run rate for the next twelve months (NTM), but that would take building out a few assumptions.
ASP Average Selling Price
It might seem like the ASP would be the average of the SaaS customers’ ACV or ARR. But it is not. ASP is tied to a timeline. Your ASP today might not be your ASP from last year, last quarter, or even last month. ACV and ARR can include the total list of customers which might have some low-priced or high-priced customers from years ago. ASP is a metric used to compare over time. In a forecast, a SaaS business might make an assumption their ASP would be $25,000 in Q2. In actuality, the ASP turned out to be $22,500. The business is missing its target. High-growth SaaS businesses must watch ASP very closely to test and retest assumptions. Things can change quickly. High-growth businesses watch ASP monthly, if not weekly.
CAC Customer Acquisition Cost

The obvious definition is “the cost to acquire a customer.” That is pretty much correct; however, there are some nuances to calculating CAC and then being able to effectively use this metric. Let’s first talk about what goes into the formula before we talk about how to use CAC. If a SaaS business is product led and has a self-serve freemium or free trial model, then marketing is the biggest expense going into CAC. However, if a SaaS business is sales led and primarily sells into enterprise customers who require significant time from a sales team, then sales costs will go into CAC on top of the marketing costs. It is not like we are calculating the cost of one specific deal, although I suppose that is possible if you don’t do many deals. What we are doing is aggregating costs and deals over a certain period of time. It is common to use a trailing twelve month (TTM) metric, however, TTM is probably too long for most SaaS companies to learn much about the effectiveness of their campaigns or sales efforts. A more valuable period of time might be tied to your average sales cycle. If you have an average sales cycle of 90 days, then using a trailing 3 months, or a quarterly CAC would fit nicely. For example, during the last 3 months a SaaS business spent $600K on sales and marketing expenses, and closed 60 new customers, the CAC would be $10,000. Because of the sales cycle of 90 days, this doesn’t truly represent what is happening to the business. A quick comparison of the prior quarter’s spend would add value here. In the prior quarter, if the business spent $500K on sales and marketing, which is when the winning leads actually came in, the same 60 new customers would have a CAC of $8,333. The lag is important but varies from one company to the next making benchmarking a little challenging.
CLV, CLTV, LTV Customer Lifetime Value

Definition: The value of a customer over their lifetime. Seem simple enough. Not so fast. First, let’s define a customer. The common denominator across B2B SaaS companies defines a customer as an entity paying for subscription to use the software offered. Surprisingly, “Freemium” models and free trials throw a wrench into pulling clean data. A customer is not a customer until there is a contract including payment terms. For the calculation of CLTV, we like to look at it both ways. Including and excluding freemium and free trial accounts. If they are included, the CLTV will be lower as the same value will be spread across a longer lifetime.
Now let’s define lifetime. It is a little too obvious to think a customer’s life is from the day they start until the day they end. If it were that easy we could simple take the average customer revenue multiplied by the average life and we’re done. Of course that will only work if you have a handful of customers or are willing to do lots and lots of math. This method also would be dependent on the data set of customers used. It would not be appropriate to use only current customers. Therefore churning customers must also be included. That is why the formula above is the most common way to calculate customer lifetime value.
Note this formula requires knowing ARPA, gross margin, and LRR. Many companies calculate CLTV without using gross margin. That would an overstating of value. The cost of goods sold (COGS) is relevant in determining a customer’s value. Afterall those COGS are what it take to service them and keep them happy along the way.
GDR Gross Dollar Retention or GRR Gross Retention Rate

This mission-critical metric is a measure of how many dollars (MRR or ARR) renewed that were up for renewal in a given period. It is similar to the logo retention rate (LRR), but tied to dollars of recurring revenue rather than a count of logos. This metric does not take into account upsells or expansions. It does however include downgrades and contraction. While the standard GDR analysis looks at trailing twelve month (TTM) periods, it is common to look at monthly and quarterly trends. A TTM gross dollar retention might be 82%, and at the same time, the most recent quarter was 90%. This indicates a SaaS business moving in the right direction.
LRR Logo Retention Rate

Logo retention rates are the original way to look at retention. Basically, it tells you what percentage of customers that were up for renewal during the period did indeed renew. This metric works great when a selling price is low and consistent, for example, B2C, or small average selling price (ASP) B2B SaaS companies. For most B2B SaaS companies selling to SMB, Mid-Market, or Enterprise, the LRR metric is not as valuable as the gross dollar retention (GDR) or net dollar retention (NDR). The LRR metric can be even more insightful when coupled with a cohort analysis. For instance, in a seasonal company, it would be valuable to know the logo retention rates by month, or quarter. A common diagnostic is to see if the LRR is above or below the GDR. Typically the LRR is a percentage point or two below the GDR as SaaS companies lose smaller revenue customers and focus on the higher revenue customers. However, if the GDR is lower than the LRR, this indicates a potential price-to-value issue as the SaaS company is losing larger revenue customers. This could be related to customer life as well. Older lower revenue customers might be sticking around while newer higher revenue customers might be churning.
NDR Net Dollar Retention or NRR Net Retention Rate
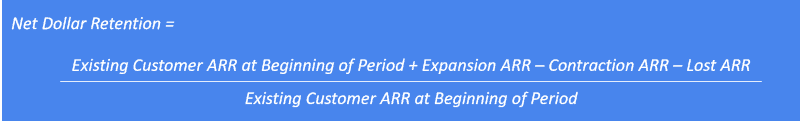
This metric covers a lot of bases. It is perhaps the most tracked metric by investors and M&A advisors. Like the gross dollar retention (GDR), the NDR takes into account downgrades and contractions. Unlike the GDR however, the NDR also includes upsells and expansions. An analysis of NDR quickly determines if the B2B SaaS business is growing its existing customer base. If the GDR and NDR are close together, say something like 92% and 93% respectively, the company is keeping customer recurring revenue, but not expanding them. This could be a product lacking routine new functionality, a pricing model that does not scale with functionality, a product that does not scale across customer departments, a missing customer success capability, or a customer success team missing opportunities. This metric is a key driver of enterprise value.